Aggregate univariate or multivariate fiscal time series from low to high frequency
faggr.RdAggregate univariate or multivariate fiscal time series from low to high frequency
Arguments
- x
a tx-boxable object at a high frequency (e.g. monthly or quarterly)
- conv_type
match the aggregated value via "first", "last", "sum", "mean". If conv_type == "uhero" then the name of the time series x is compared to the internal variable
sum_pattern. For matching series names the aggregation is based on "sum"; for all others it is based on "mean."- target_freq
target frequency "year", "quarter", "month", "week"
- na_rm
logical, if TRUE, incomplete periods are aggregated as well. For irregular series, incomplete periods are always aggregated.
Details
date stamps typically reflect the start of a period, but here the date stamps in the result are shifted 6 months forward relative to calendar dates, so Jul21 becomes Jan22, or 2022-01-01, and 21Q3 becomes 22Q1.
Examples
monthly_data_example |>
faggr(conv_type = "sum", target_freq = "quarter")
#> # A tibble: 98 × 4
#> time VISNS_HI VAPNS_HI VADCNS_HI
#> <date> <dbl> <dbl> <dbl>
#> 1 2001-04-01 1686. 1797. 487.
#> 2 2001-07-01 1730. 1774. 531.
#> 3 2001-10-01 1683. 1853. 479.
#> 4 2002-01-01 1650. 1835. 486.
#> 5 2002-04-01 1287. 1440. 402.
#> 6 2002-07-01 1558. 1655. 489.
#> 7 2002-10-01 1600. 1773. 460.
#> 8 2003-01-01 1701. 1900. 502.
#> 9 2003-04-01 1594. 1765. 471.
#> 10 2003-07-01 1580. 1730. 491.
#> # ℹ 88 more rows
monthly_data_example |>
faggr(conv_type = "uhero", target_freq = "quarter")
#> # A tibble: 98 × 4
#> time VISNS_HI VAPNS_HI VADCNS_HI
#> <date> <dbl> <dbl> <dbl>
#> 1 2001-04-01 1686. 1797. 162.
#> 2 2001-07-01 1730. 1774. 177.
#> 3 2001-10-01 1683. 1853. 160.
#> 4 2002-01-01 1650. 1835. 162.
#> 5 2002-04-01 1287. 1440. 134.
#> 6 2002-07-01 1558. 1655. 163.
#> 7 2002-10-01 1600. 1773. 153.
#> 8 2003-01-01 1701. 1900. 167.
#> 9 2003-04-01 1594. 1765. 157.
#> 10 2003-07-01 1580. 1730. 164.
#> # ℹ 88 more rows
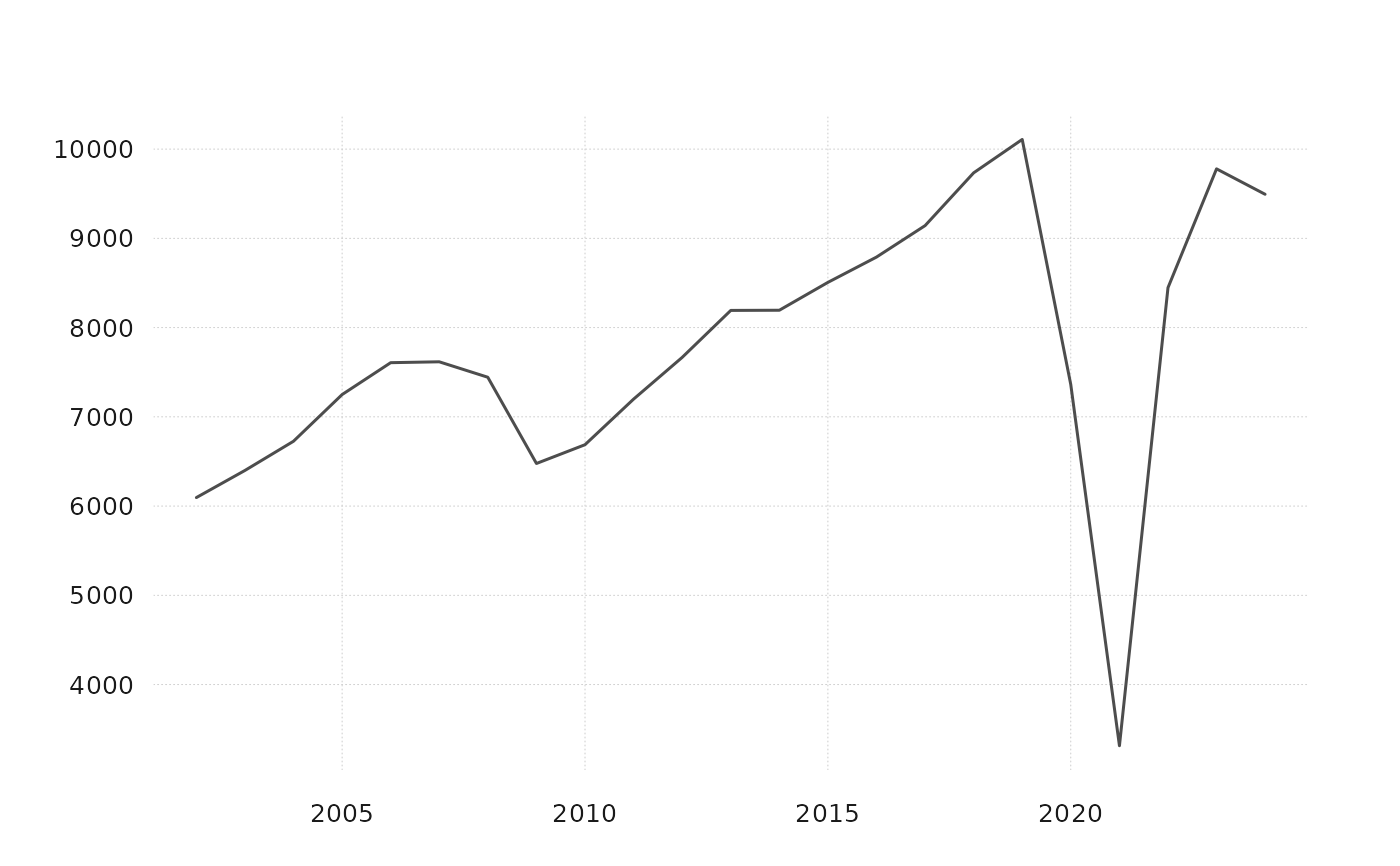
# works with a single series too
monthly_data_example |>
tsbox::ts_long() |>
tsbox::ts_pick("VISNS_HI") |>
faggr(conv_type = "uhero", target_freq = "year") |>
tsbox::ts_plot()